Thread Rating:
  • 504 Vote(s) - 2.79 Average
  • 1
  • 2
  • 3
  • 4
  • 5
Page 8: Extra Practice
06-20-2011, 01:10 PM, (This post was last modified: 06-23-2011, 04:20 PM by ashimo.)
#1
Page 8: Extra Practice
Extra Practice

Let’s use options to change the format and colors of a graph.

Practice Problem 1: Basics

Define data like that shown below, and then display a cumulative bar graph for the score1 and score2 data fields. For the x-axis label, use the name field.

Code:
let data:RecordSet = {RecordSet
                         {RecordFields
                             {RecordField name, domain = String},
                             {RecordField score1, domain = int},
                             {RecordField score2, domain = int}
                         },
                         {RecordData name = Matt, score1 = 30, score2 = 45},
                         {RecordData name = Sarah, score1 = 55, score2 = 40},
                         {RecordData name = Jacob, score1 = 20, score2 = 65}
                     }


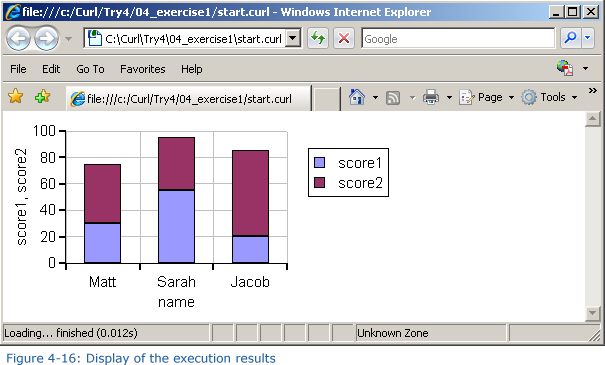
Hint: To display the cumulative graph, use stacking-mode = ChartStackingMode.stacked with BarLayer.

Solution

Solution Program: c:\Curl\Try4\04_exercise1\start.curl

Code:
{import * from CURL.GUI.CHARTS}
{value
    let data:RecordSet =
        {RecordSet
            {RecordFields
                {RecordField name, domain = String},
                {RecordField score1, domain = int},
                {RecordField score2, domain = int}
            },
            {RecordData name = Matt, score1 = 30, score2 = 45},
            {RecordData name = Sarah, score1 = 55, score2 = 40},
            {RecordData name = Jacob, score1 = 20, score2 = 65}
        }
    
    let chart:LayeredChart = {LayeredChart
                                 height = 5cm,
                                 width = 10cm,
                                 {BarLayer
                                     stacking-mode = ChartStackingMode.stacked,
                                     x-axis-data = {ChartDataSeries data, name},
                                     {ChartDataSeries data, score1},
                                     {ChartDataSeries data, score2}
                                 }
                             }
    chart
}

Practice Problem 2: Basics

Display the data used with Practice Problem 1 as a bar graph. In this problem, reverse the directions of the x- and y-axes and then display the graph.


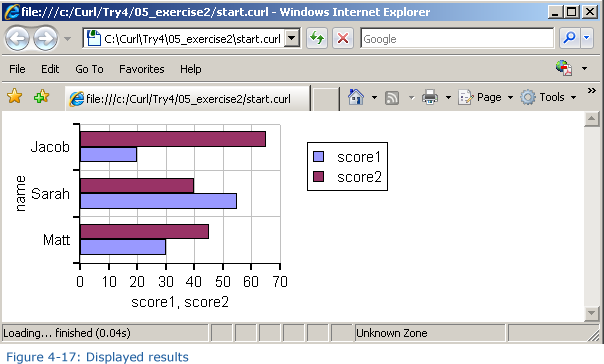
Hint: To change the orientation of the graph, use flipped? = true with LayeredChart.

Solution

Solution Program: c:\Curl\Try4\05_exercise2\start.curl

Code:
{import * from CURL.GUI.CHARTS}
{value
    let data:RecordSet =
        {RecordSet
            {RecordFields
                {RecordField name, domain = String},
                {RecordField score1, domain = int},
                {RecordField score2, domain = int}
            },
            {RecordData name = Matt, score1 = 30, score2 = 45},
            {RecordData name = Sarah, score1 = 55, score2 = 40},
            {RecordData name = Jacob, score1 = 20, score2 = 65}`
        }
    
    let chart:LayeredChart = {LayeredChart
                                 height = 5cm,
                                 width = 10cm,
                                 flipped? = true,
                                 {BarLayer
                                     x-axis-data = {ChartDataSeries data, name},
                                     {ChartDataSeries data, score1},
                                     {ChartDataSeries data, score2}
                                 }
                             }
    chart
}

Practice Problem 3: Basics

Using the same data as that used in Practice Problem 1, display the score1 data as a bar graph, and the score2 data as a line graph, as shown in the figure below:


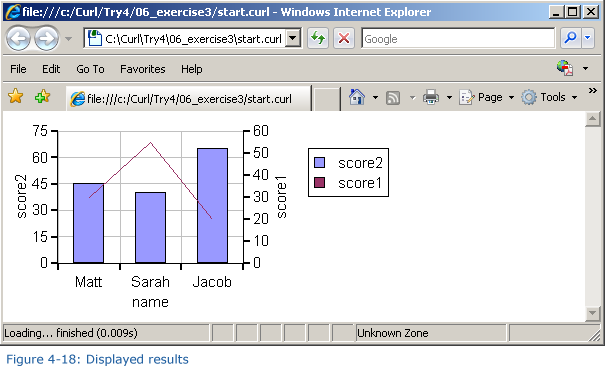
Hint: LayeredChart can have multiple ChartLayers.

Solution

Solution Program: c:\Curl\Try4\06_exercise3\start.curl

Code:
{import * from CURL.GUI.CHARTS}
{value
    let data:RecordSet =
        {RecordSet
            {RecordFields
                {RecordField name, domain = String},
                {RecordField score1, domain = int},
                {RecordField score2, domain = int}
            },
            {RecordData name = Matt, score1 = 30, score2 = 45},
            {RecordData name = Sarah, score1 = 55, score2 = 40},
            {RecordData name = Jacob, score1 = 20, score2 = 65}
        }
    
    let chart:LayeredChart = {LayeredChart
                                 height = 5cm,
                                 width = 10cm,
                                 {BarLayer
                                     x-axis-data = {ChartDataSeries data, name},
                                     {ChartDataSeries data, score2}
                                 },
                                 {LineLayer
                                     {ChartDataSeries data, score1}
                                 }
                             }
    
    chart
}


Messages In This Thread
Page 8: Extra Practice - by ashimo - 06-20-2011, 01:10 PM

Possibly Related Threads...
Thread Author Replies Views Last Post
  Page 5: Application 2: Specifying the Graph Colors ashimo 1 5,739 11-19-2016, 01:59 PM
Last Post: milijacob
  Page 7: Summary ashimo 0 3,282 06-20-2011, 01:09 PM
Last Post: ashimo
  Page 6: Structure of a Program that Specifies the Graph Colors ashimo 0 3,428 06-20-2011, 01:08 PM
Last Post: ashimo
  Page 4: Structure of a Program that Specifies the Graph Axes ashimo 0 3,496 06-20-2011, 01:06 PM
Last Post: ashimo
  Page 3: Application 1: Specifying the Graph Axes ashimo 0 3,417 06-20-2011, 01:05 PM
Last Post: ashimo
  Page 2: Structure of a Program that Displays Data as a Graph ashimo 0 3,413 06-20-2011, 01:03 PM
Last Post: ashimo
  Page 1: Displaying Data as a Graph ashimo 0 3,160 06-20-2011, 11:59 AM
Last Post: ashimo
Forum Jump:


Users browsing this thread:
1 Guest(s)

MyBB SQL Error

MyBB has experienced an internal SQL error and cannot continue.

SQL Error:
1017 - Can't find file: 'mybb_threadviews' (errno: 2)
Query:
INSERT INTO mybb_threadviews (tid) VALUES('70')