

Curl Global Community
›
Tutorials
›
Public Training
›
Curl IDE Made Easy
›
Try 4: Displaying Data as a Graph
 Page 1: Displaying Data as a Graph
Page 1: Displaying Data as a Graph
Page 1: Displaying Data as a Graph
|
06-20-2011, 11:59 AM,
(This post was last modified: 06-23-2011, 04:16 PM by ashimo.)
|
|||||
|
|||||
Page 1: Displaying Data as a Graph
 Try 4: Displaying Data as a Graph Try 4: Displaying Data as a GraphIn this chapter, we’ll display our game scores as a graph. Please download the Try4.zip file by selecting the following link: Try4.zip. Unzip the contents to the C:\Curl directory. This is the working directory for all the examples and exercises contained within this tutorial. Note: If C:\Curl has not already been created, you can create it now.  Basics: Displaying Data as a Graph Basics: Displaying Data as a Graph Create the 'Try 4-1' Project Create the 'Try 4-1' ProjectClose the Try 3 project and then, from the IDE 'File' menu, select 'New Project'. In the 'New Project' dialog box, select “Applet Project” (1), input “Try4-1” (2), specify c:\Curl\lesson\Try4\01_bar_graph in the “Directory” field (3), set the API Version to 6.0 (4), and then click OK (5). 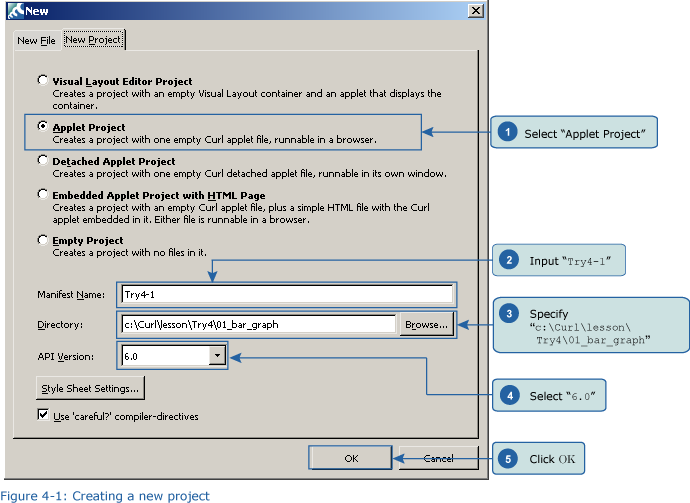  Inputting the Program Inputting the ProgramNext, we’ll input the program. You can copy the program code below or use c:\Curl\Try4\01_bar_graph\start.curl and then paste it into the editor in the IDE. Code: {import * from CURL.GUI.CHARTS} Save the File, and then Execute the Program Save the File, and then Execute the ProgramAfter inputting the code, save the file, and then execute the program. The following result will appear in your browser. 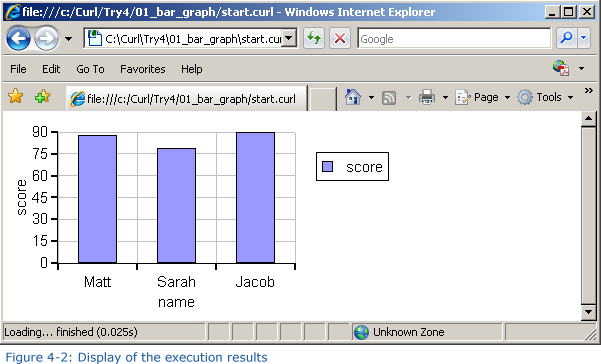 |
|||||


|
« Next Oldest | Next Newest »
|
| Possibly Related Threads... | |||||
| Thread | Author | Replies | Views | Last Post | |
| Page 5: Application 2: Specifying the Graph Colors | ashimo | 1 | 5,739 |
11-19-2016, 01:59 PM Last Post: milijacob |
|
| Page 8: Extra Practice | ashimo | 0 | 3,624 |
06-20-2011, 01:10 PM Last Post: ashimo |
|
| Page 7: Summary | ashimo | 0 | 3,282 |
06-20-2011, 01:09 PM Last Post: ashimo |
|
| Page 6: Structure of a Program that Specifies the Graph Colors | ashimo | 0 | 3,428 |
06-20-2011, 01:08 PM Last Post: ashimo |
|
| Page 4: Structure of a Program that Specifies the Graph Axes | ashimo | 0 | 3,496 |
06-20-2011, 01:06 PM Last Post: ashimo |
|
| Page 3: Application 1: Specifying the Graph Axes | ashimo | 0 | 3,417 |
06-20-2011, 01:05 PM Last Post: ashimo |
|
| Page 2: Structure of a Program that Displays Data as a Graph | ashimo | 0 | 3,413 |
06-20-2011, 01:03 PM Last Post: ashimo |
|
Users browsing this thread:
1 Guest(s)
1 Guest(s)