

Curl Global Community
›
Tutorials
›
Public Training
›
Curl IDE Made Easy
›
Try 4: Displaying Data as a Graph
 Page 5: Application 2: Specifying the Graph Colors
Page 5: Application 2: Specifying the Graph Colors
Page 5: Application 2: Specifying the Graph Colors
|
06-20-2011, 01:07 PM,
(This post was last modified: 06-23-2011, 04:18 PM by ashimo.)
|
|||||
|
|||||
Page 5: Application 2: Specifying the Graph Colors
 Application 2: Specifying the graph colors Application 2: Specifying the graph colorsThe graphs that we have looked at so far have all used preset colors. We can, however, use options to change the graph color.  Create the 'Try 4-3' Project Create the 'Try 4-3' ProjectClose the Try 4-2 project and then, from the IDE 'File' menu, select 'New Project'. In the 'New Project' dialog box, select “Applet Project” (1), input “Try4-3” (2), specify c:\Curl\lesson\Try4\03_graph_color in the “Directory” field (3), set the API Version to 6.0 (4), and then click OK (5). 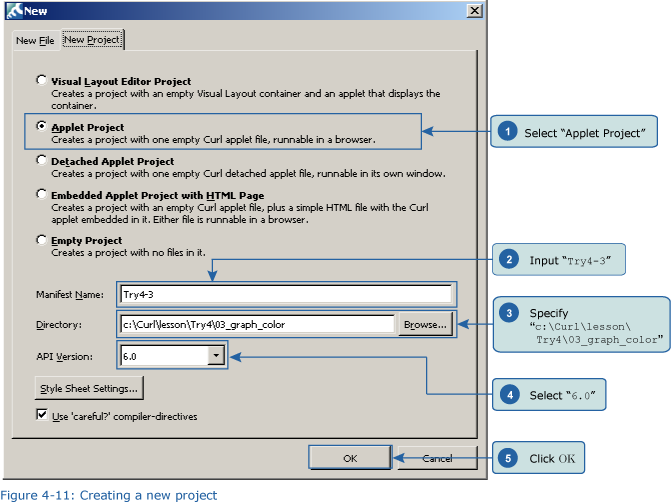  Inputting the Program Inputting the ProgramNext, we’ll input the program. You can copy the program code below or use c:\Curl\Try4\03_graph_color\start.curl and then paste it into the editor in the IDE. Code: {curl 6.0 applet} Save the File, and then Execute the Program Save the File, and then Execute the ProgramAfter inputting the code, save the file, and then execute the program. The following result will appear in your browser. 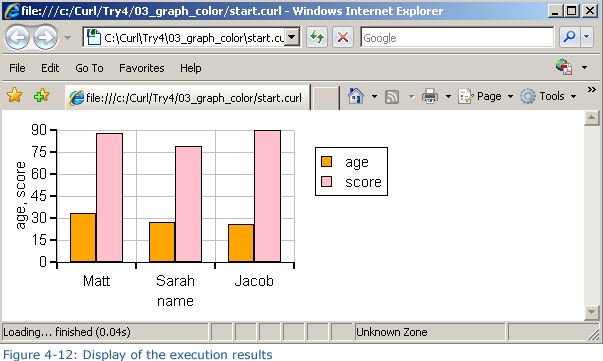 The samples that we have looked at so far have all used preset colors for the graphs. Here, we have set whatever color we like for our graph display. |
|||||


|
11-19-2016, 01:59 PM,
|
|||||
|
|||||
|
RE: Page 5: Application 2: Specifying the Graph Colors
This seems to be great application and i found it very helpful for giving colors to my graph. Thanks for sharing this in detail.
|
|||||
|
« Next Oldest | Next Newest »
|
| Possibly Related Threads... | |||||
| Thread | Author | Replies | Views | Last Post | |
| Page 8: Extra Practice | ashimo | 0 | 3,624 |
06-20-2011, 01:10 PM Last Post: ashimo |
|
| Page 7: Summary | ashimo | 0 | 3,282 |
06-20-2011, 01:09 PM Last Post: ashimo |
|
| Page 6: Structure of a Program that Specifies the Graph Colors | ashimo | 0 | 3,428 |
06-20-2011, 01:08 PM Last Post: ashimo |
|
| Page 4: Structure of a Program that Specifies the Graph Axes | ashimo | 0 | 3,496 |
06-20-2011, 01:06 PM Last Post: ashimo |
|
| Page 3: Application 1: Specifying the Graph Axes | ashimo | 0 | 3,417 |
06-20-2011, 01:05 PM Last Post: ashimo |
|
| Page 2: Structure of a Program that Displays Data as a Graph | ashimo | 0 | 3,413 |
06-20-2011, 01:03 PM Last Post: ashimo |
|
| Page 1: Displaying Data as a Graph | ashimo | 0 | 3,160 |
06-20-2011, 11:59 AM Last Post: ashimo |
|
Users browsing this thread:
1 Guest(s)
1 Guest(s)