+- Curl Global Community (https://communities.curl.com)
+-- Forum: Tutorials (https://communities.curl.com/forumdisplay.php?fid=3)
+--- Forum: Public Training (https://communities.curl.com/forumdisplay.php?fid=4)
+---- Forum: Curl IDE Made Easy (https://communities.curl.com/forumdisplay.php?fid=6)
+----- Forum: Try 4: Displaying Data as a Graph (https://communities.curl.com/forumdisplay.php?fid=12)
+----- Thread: Page 2: Structure of a Program that Displays Data as a Graph (/showthread.php?tid=64)
Page 2: Structure of a Program that Displays Data as a Graph - ashimo - 06-20-2011
 Structure of the Program that Displays Data as a Graph
In Try 3, we displayed the RecordSet data as a grid. In this chapter, we will concentrate on displaying RecordSet data using different types of charts.
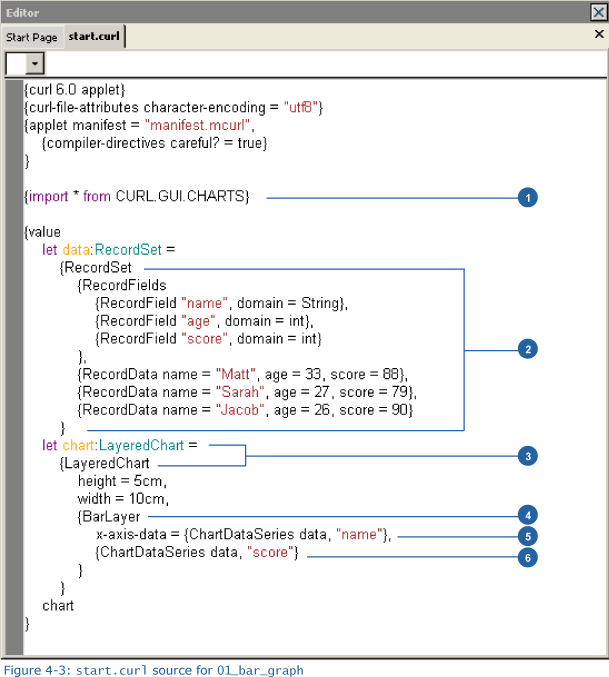
So, let’s start by taking a look at the program’s source code.

1. Importing the 'CURL.GUI.CHARTS' package
Code:
{import * from CURL.GUI.CHARTS}The API needed to create a graph can be found the CURL.GUI.CHARTS package. By using an import statement to import this package, we can then use the necessary functions provided by the package.
 Packages
A package contains logically grouped code. We can import packages and use the definitions in those packages.
2. Converting data to a graph
Code:
let data:RecordSet =

    {RecordSet

        {RecordFields

            {RecordField name, domain = String},

            {RecordField age, domain = int},

            {RecordField score, domain = int}

        },

        {RecordData name = Matt, age = 33, score = 88},

        {RecordData name = Sarah, age = 27, score = 79},

        {RecordData name = Jacob, age = 26, score = 90}

    }
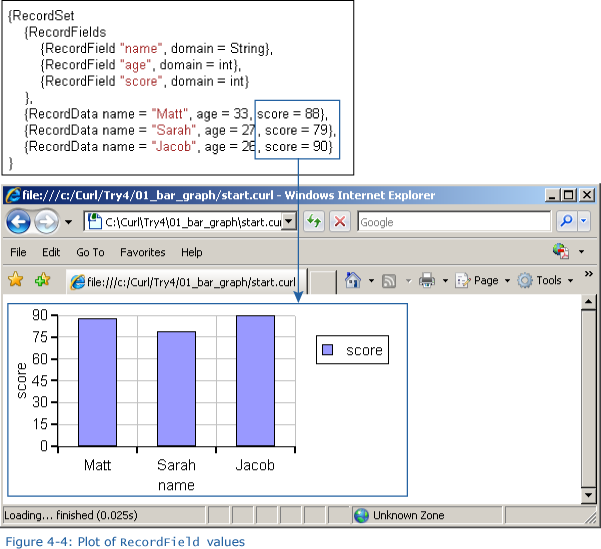
To create a graph, we use the RecordSet data. We’ll plot a graph for each RecordField value in the RecordSet.

3. Creating a 'LayeredChart'
Code:
let chart:LayeredChart =

    {LayeredChart

        ...

    }
In the same way as for a bar or line graph, a LayeredChart requires that, prior to plotting any data, we define a 2-dimensional area with an x- and y-axis. We will next add the layer to our LayeredChart and then plot our graph.
4. Specifying a Layer
Code:
{BarLayer

    ...

}
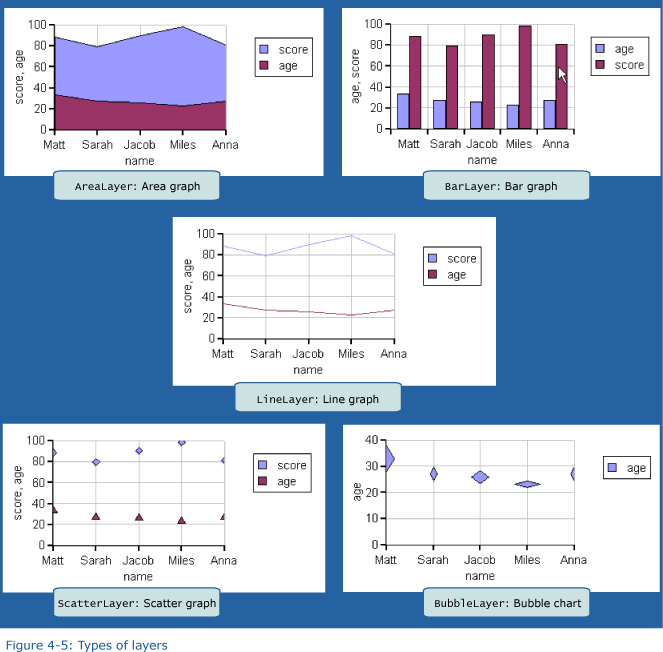
We specify a layer to define the data to be plotted, as well as the plotting method (bar graph, line graph, etc.). In this example, in which we create a bar graph, we specify a BarLayer. Figure 4-5 shows the available layer types.

5. Specifying a label for the X-axis
Code:
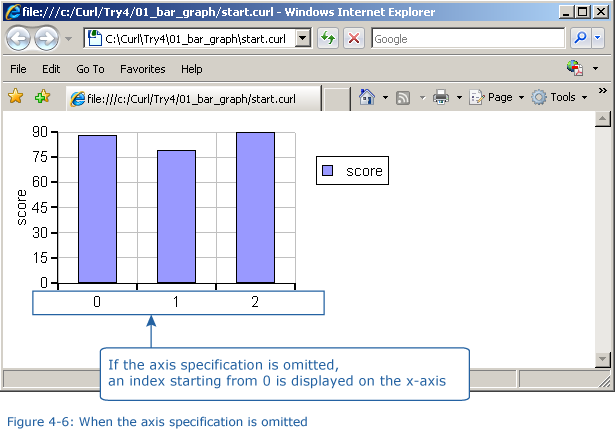
x-axis-data = {ChartDataSeries data, name}The x-axis-data keyword argument controls the labeling of the x-axis. Using this argument, we can specify the field values used as captions on the -x-axis If we omit this argument, then an index starting from 0 is displayed on the x-axis. This x-axis information is specified using ChartDataSeries.

6. Specifying graph data
Code:
{ChartDataSeries data, score}We also use ChartDataSeries to specify the data to be plotted on a graph. We specify the RecordSet containing the data, as well as the names of the fields we want to display on the graph. Although we can specify multiple ChartDataSeries, in this example, we specify only one.
 LayeredChart and PieChart
Curl supports two main types of graphs. The first type plots data in two dimensions, using x- and y-axes, like the bar graph in the example in Try 4-1. This type of graph is created using LayeredChart. The second type is the pie graph. To create a pie graph, we use PieChart. For a pie graph, rather than specify each layer, we use PieSet to specify the data to be plotted. By specifying multiple instances of PieSet, we can create a graph consisting of concentric circles. And, by using label-data, we can also display labels.