

Curl Global Community
›
Tutorials
›
Public Training
›
Curl IDE Made Easy
›
Try 4: Displaying Data as a Graph
 Page 3: Application 1: Specifying the Graph Axes
Page 3: Application 1: Specifying the Graph Axes
Page 3: Application 1: Specifying the Graph Axes
|
06-20-2011, 01:05 PM,
(This post was last modified: 06-23-2011, 04:17 PM by ashimo.)
|
|||||
|
|||||
Page 3: Application 1: Specifying the Graph Axes
 Application 1: Specifying the graph axes Application 1: Specifying the graph axesNext, we’ll specify the gradations and positions of the graph axes.  Create the 'Try 4-2' Project Create the 'Try 4-2' ProjectClose the Try 4 project and then, from the IDE 'File' menu, select 'New Project'. In the 'New Project' dialog box, select “Applet Project” (1), input “Try4-2” (2), specify c:\Curl\lesson\Try4\02_set_axis in the “Directory” field (3), set the API Version to 6.0 (4), and then click OK (5). 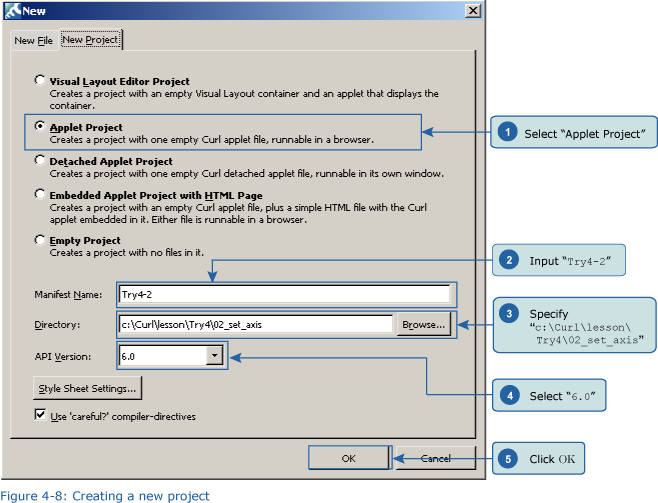  Inputting the Program Inputting the ProgramNext, we’ll input the program. You can copy the program code below or use c:\Curl\Try4\02_set_axis\start.curl and then paste it into the editor in the IDE. Code: {import * from CURL.GUI.CHARTS} Save the File, and then Execute the Program Save the File, and then Execute the ProgramAfter inputting the code, save the file, and then execute the program. The following result will appear in your browser. 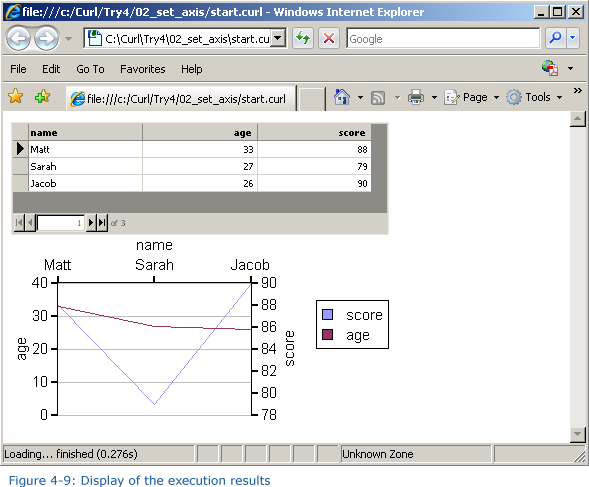
|
|||||


|
« Next Oldest | Next Newest »
|
| Possibly Related Threads... | |||||
| Thread | Author | Replies | Views | Last Post | |
| Page 5: Application 2: Specifying the Graph Colors | ashimo | 1 | 5,739 |
11-19-2016, 01:59 PM Last Post: milijacob |
|
| Page 8: Extra Practice | ashimo | 0 | 3,624 |
06-20-2011, 01:10 PM Last Post: ashimo |
|
| Page 7: Summary | ashimo | 0 | 3,282 |
06-20-2011, 01:09 PM Last Post: ashimo |
|
| Page 6: Structure of a Program that Specifies the Graph Colors | ashimo | 0 | 3,428 |
06-20-2011, 01:08 PM Last Post: ashimo |
|
| Page 4: Structure of a Program that Specifies the Graph Axes | ashimo | 0 | 3,496 |
06-20-2011, 01:06 PM Last Post: ashimo |
|
| Page 2: Structure of a Program that Displays Data as a Graph | ashimo | 0 | 3,413 |
06-20-2011, 01:03 PM Last Post: ashimo |
|
| Page 1: Displaying Data as a Graph | ashimo | 0 | 3,160 |
06-20-2011, 11:59 AM Last Post: ashimo |
|
Users browsing this thread:
2 Guest(s)
2 Guest(s)