

Curl Global Community
›
Tutorials
›
Public Training
›
Curl IDE Made Easy
›
Try 4: Displaying Data as a Graph
 Page 4: Structure of a Program that Specifies the Graph Axes
Page 4: Structure of a Program that Specifies the Graph Axes
Page 4: Structure of a Program that Specifies the Graph Axes
|
06-20-2011, 01:06 PM,
(This post was last modified: 06-23-2011, 04:18 PM by ashimo.)
|
|||||
|
|||||
|
Page 4: Structure of a Program that Specifies the Graph Axes
Structure of program that specifies the graph axes
Let’s specify the axes for the graph introduced in the “Basics” section. 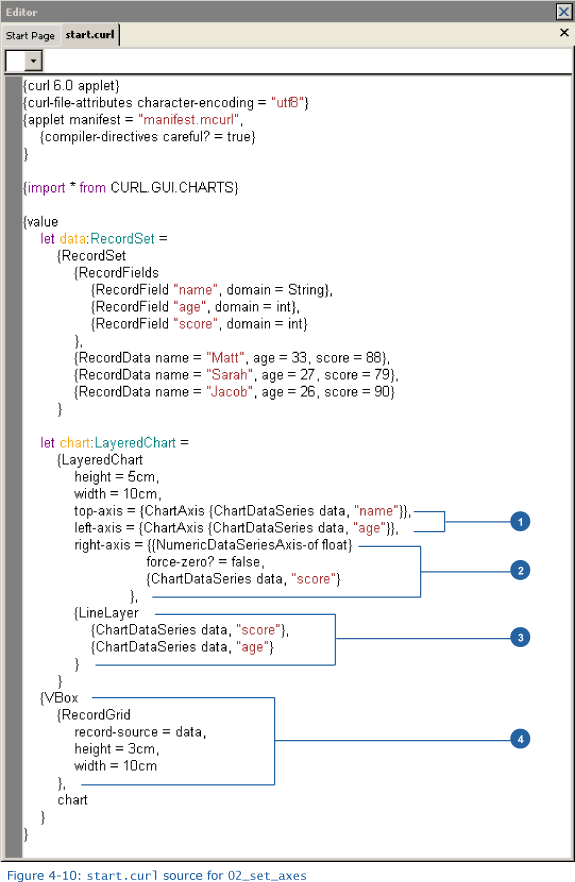 1. Specifying the positions of the axes Code: top-axis = {ChartAxis {ChartDataSeries data, name}},The LayeredChart class has four options, namely, top-axis, bottom-axis, right-axis, and left-axis. Using these, we can place the four sides of a graph wherever we wish. In our example here, we specify the top and left sides of the graph. The specification is made using ChartAxis. 2. Specifying the range of axis gradations Code: right-axis = {{NumericDataSeriesAxis-of float} Using right-axis we specify the right axis. In (1), we used ChartAxis, but in this example we’ll use NumericDataSeriesAxis-of. NumericDataSeriesAxis-of lets us set the range of the axis gradations, by specifying a minimum and maximum value. Here, by setting force-zero? to false, 0 is not displayed and the axis range is automatically set to cover an appropriate range. 3. Creating a line graph Code: {LineLayerHere, rather than create a bar graph, we will plot a line graph. To do this, we use LineLayer. Because the axes are specified with the LayeredChart, there is no need for the x-axis-data specification. 4. Displaying the layout Code: {VBoxThe final expression in the value block specifies the layout. Here, we use a RecordGrid to also display the data in the same RecordSet. When RecordGrid is used to modify the data, the graph values will also be modified in real time because any changes to RecordSet values that are used as data are automatically reflected on the graph. |
|||||


|
« Next Oldest | Next Newest »
|
| Possibly Related Threads... | |||||
| Thread | Author | Replies | Views | Last Post | |
| Page 5: Application 2: Specifying the Graph Colors | ashimo | 1 | 5,739 |
11-19-2016, 01:59 PM Last Post: milijacob |
|
| Page 8: Extra Practice | ashimo | 0 | 3,624 |
06-20-2011, 01:10 PM Last Post: ashimo |
|
| Page 7: Summary | ashimo | 0 | 3,282 |
06-20-2011, 01:09 PM Last Post: ashimo |
|
| Page 6: Structure of a Program that Specifies the Graph Colors | ashimo | 0 | 3,428 |
06-20-2011, 01:08 PM Last Post: ashimo |
|
| Page 3: Application 1: Specifying the Graph Axes | ashimo | 0 | 3,417 |
06-20-2011, 01:05 PM Last Post: ashimo |
|
| Page 2: Structure of a Program that Displays Data as a Graph | ashimo | 0 | 3,413 |
06-20-2011, 01:03 PM Last Post: ashimo |
|
| Page 1: Displaying Data as a Graph | ashimo | 0 | 3,160 |
06-20-2011, 11:59 AM Last Post: ashimo |
|
Users browsing this thread:
1 Guest(s)
1 Guest(s)