|
06-20-2011, 01:49 PM,
(This post was last modified: 06-23-2011, 04:34 PM by ashimo.)
|
|||||
|
|||||
Page 6: Structure of a Program that Creates the Screen Layout
 Structure of the Program that Creates the Screen Layout Structure of the Program that Creates the Screen Layout 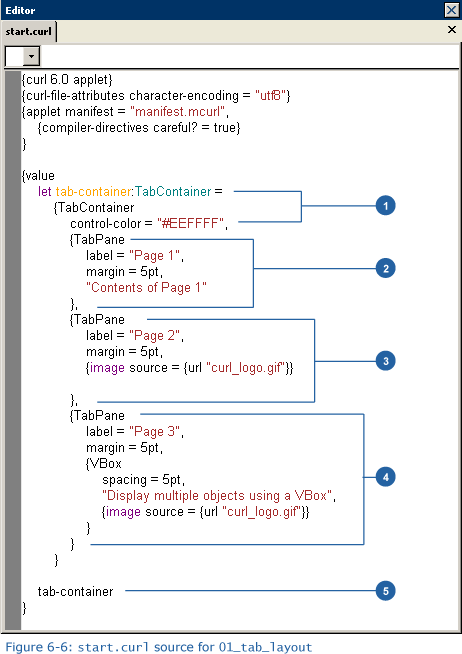 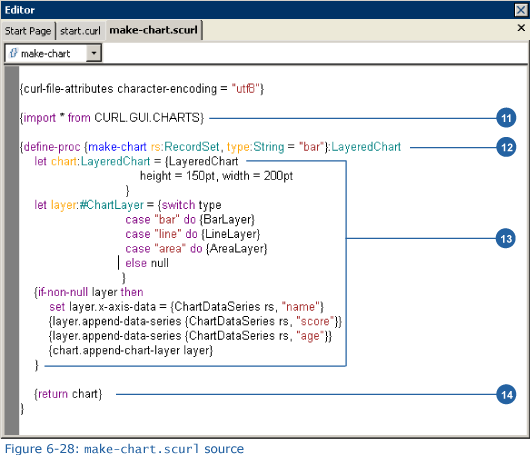 So, let’s take a look at the source code. This is the largest example that we’ve seen so far. Please think of it as a review of what we’ve seen. 1. Including an scurl file Code: {include make-chart.scurl}The contents of the file in the specified path are included at the location specified with include. In our example, this expression has the same meaning as including the contents of the make-chart.scurl file are the same as those described at this location. Using scurl files, it is easy to break up and manage large collections of code. It is also possible to include multiple files into a single scurl file. Unlike applets with the .curl extension, files with the .scurl extension cannot be executed individually. As in the case of our example, .scurl files contain code that becomes part of a larger application. Curl supports several other file extensions. Some examples are shown below. 2. Creating an input field Code: let name-field:TextField = {TextField width = 100pt}The above code declares TextFields that are used for input. 3. RecordSet declaration Code: let data:RecordSet =The above code creates the RecordSet that contains the data to be displayed as a grid or graph. 4. Creating HBox for the headers Code: let header:HBox =The above code creates the header that is displayed at the top of the screen. The HBox includes images and the title text. The images and text are separated by Fill objects. Fills are used to fill up spaces in a layout. The following illustration shows how this is done. 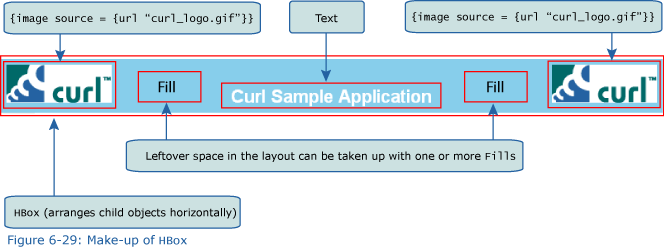 When used with no width or height specification as in this example, Fill stretches elastically to fill extra space. Each Fill object stretches by the same amount, causing the title to be centered in the HBox. Fill objects can also have specified height and/or width properties, in which case they will take on the specified size and will not stretch.
Code: {Fill5. Creating an input form layout Code: let input-form:VBox =If we look at the contents of the first page tab, we find that there is an area for inputting data, as well as a grid for displaying that data. Here, we’ll create the area that is used for input. VBox contains two objects, namely Table and CommandButton. 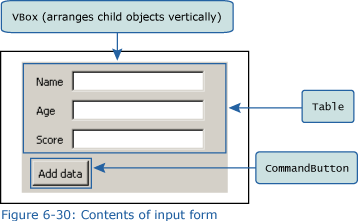 Table arranges objects into rows and columns for display. When we create a Table, we can initially specify the number of columns and then specify the data contained in each row. 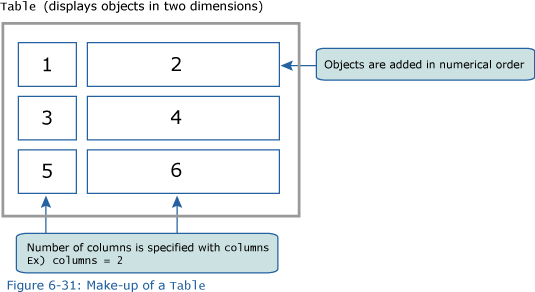 Note: There are many different ways of creating and manipulating a Table. For details, see the Developer's Guide. Next, let’s take a look at the command buttons. When a button is clicked, the corresponding event handler stores the input value (using the value from in each text field) into RecordData, and adds it to RecordSet. Then, that change is finalized using commit. Changes can be undone using revert, which restores the state existing when commit was previously applied. For a RecordSet, data can be modified using append, delete, and so on. 6. Creating a central TabContainers Code: let tab-container:TabContainer =Here, we’ll create a TabContainer that is displayed in the center of the screen. We can use options to specify a width and a height. For width, which we use to specify using the width property, we won’t specify a fixed value such as 100 pt. Instead, we’ll specify the width using the {make-elastic} expression. By specifying {make-elastic} for the height and width, we create objects that can expand and contract. If, after estimating the size of the outside object, there is still space available, then the object can be enlarged. If there isn’t enough space, however, then the object made smaller. This is how the height and width are determined. {make-elastic} also allows us to specify the smallest size and the initial size before expansion/contraction. Please refer to the Curl documentation for more information. In our example, the data is read, line-by-line, and then added to the character string array. 7. First page TabPane Code: {TabPane By using VBox in the first page tab, we can display the input-form and RecordGrid. The input-form variable stores the input area defined in (5). 8. Second page TabPane Code: {TabPaneThe execution results are displayed as a graph on the second page tab. The corresponding code is {make-chart data, type = ”char”} where make-chart is the name of a procedure. A procedure is a type of function that receives data known as arguments, performs predefined processing, and then returns the results. The definition of a procedure is explained below.  Calling a Procedure Calling a ProcedureCode: {Procedure_name [argument_1, argument_2,…]}When specifying multiple arguments, we delimit each argument with a comma (,). 9. Creating HBox for the footer Code: let footer:HBox =The above creates the footer that is displayed at the bottom of the screen. Here, again, we use make-elastic for the width. 10. VBox for displaying the overall layout Code: {VBoxThe overall layout that appears on the screen is defined at the end of the value expression. The VBox contains the header, TabContainer, and footer that are displayed. Next, we’ll take a look at the code contained in the make-chart.scurl file. 11. Importing a graph creation package Code: {import * from CURL.GUI.CHARTS}We need to import the Curl package that allows us to create graphs. Note that this package must be explicitly imported. 12.Defining a procedure Code: {define-proc {make-chart rs:RecordSet, type:String = [color=red]bar[/color]}:LayeredChartIn (8), we looked at procedures and how they can be called. Here, we’ll discuss how to define a procedure. A procedure is defined using the define-proc keyword. We can then specify a name for a procedure. We can actually specify any legal variable name, but the most common naming convention involves using all lower-case characters and “-“ as a delimiter between words. After that, we can specify arguments. When there are multiple arguments to be specified, we delimit them with commas (,). Lastly, we specify the type of the value returned by the procedure. Curl functions can return zero or more values. To deal with multiple return values, we specify the return value types as (return_value_type_1, return_value_type_2) using “()” and “,” as delimiters. When no value is to be returned, we specify void.  Procedure definition Procedure definitionCode: {define-proc {procedure_name [argument_1, argument_2,…]}: return_value Procedure definition (with multiple return values) Procedure definition (with multiple return values)Code: {define-proc {procedure_name [argument_1, argument_2,…]}: (return_value_1, return_value_2) Procedure definition (when nothing is returned) Procedure definition (when nothing is returned)Code: {define-proc {procedure_ name [argument_1, argument_2,…]}:voidIf we take a closer look at this example, we see that two arguments are declared for our procedure, and that the declaration of each argument varies slightly. In Curl, there are several different ways of declaring arguments. Please consult the Curl documentation for more information. Argument example 1 Code: {define-proc {function1 param1:int, param2:double}:doubleIn the argument declaration, argument_name: argument_type must be specified when the procedure is declared. In our example, the “5” and “1.52” in {function1 5, 1.52} are specified to call the procedure. In calculations, the first “5” is substituted for param1, when the subsequent “1.52” is substituted for param2. In this type of case, where the order determines the value that will be substituted for an argument, we refer to the arguments as positional arguments. Argument example 2 Code: {define-proc {function2 param1:int = 1, param2:double = 0.0}:doubleIn these argument declarations, we specify argument_name:argument_type = value to declare the arguments. In the examples, the procedure arguments are described in four different ways. All of these are valid ways of calling this procedure. In the case of , calling the procedure without specifying an argument, we use the default argument values specified in the procedure declaration. Unlike a positional argument, this kind of argument is not understood based on its position but instead on argument_name = value, whereby we look at the argument name to determine the argument that is intended. As a result, we can set the correct values for arguments without having to use a standard order. Such arguments are known as keyword arguments. As in our example, positional and keyword arguments can be used together. In a declaration, the recommended specification method involves first describingt the positional arguments, followed by the keyword arguments. In addition, we can also declare rest arguments, which allow a procedure to have a variable number of arguments. Rest arguments are indicated by a string of three periods (…). Example procedure using rest arguments Code: {define-proc {function3 param1, param2:double = 0.0, ...}:double
In our example, when we call make-chart, we must specify the RecordSet value for the rs argument and, if necessary, pass a character string to the type argument. 13.Creating the graphs Code: let chart:LayeredChart =Here, we’ll use the LayeredChart class to create a graph. In this example, ChartLayer and ChartDataSeries are not specified when LayeredChart is declared, but instead are added later using append-data-series and append-chart-layer. And, using the switch expression, the format of the graph is determined from the arguments passed to the procedure. 14.Specifying return values Code: {return chart}The value returned by a procedure is specified using the return expression. If there is no return value (when void has been specified), the return expression is not necessary. Also, when there are multiple return values, these are specified with {return return_value_1, return_value_2, …}, delimited with commas (,). |
|||||
|
« Next Oldest | Next Newest »
|
| Messages In This Thread |
|
Page 6: Structure of a Program that Creates the Screen Layout - by ashimo - 06-20-2011, 01:49 PM
|
| Possibly Related Threads... | |||||
| Thread | Author | Replies | Views | Last Post | |
| Page 8: Extra Practice | ashimo | 0 | 3,425 |
06-20-2011, 01:55 PM Last Post: ashimo |
|
| Page 7: Summary | ashimo | 0 | 3,037 |
06-20-2011, 01:51 PM Last Post: ashimo |
|
| Page 5: Application: Creating the Screen Layout | ashimo | 0 | 3,027 |
06-20-2011, 01:46 PM Last Post: ashimo |
|
| Page 4: Structure of a Program that uses a Tab Accordion to Create the Layout | ashimo | 0 | 2,951 |
06-20-2011, 01:44 PM Last Post: ashimo |
|
| Page 3: Basics 2: Using a Tab Accordion to Display a Layout | ashimo | 0 | 3,026 |
06-20-2011, 01:43 PM Last Post: ashimo |
|
| Page 2: Structure of a Program that uses Tab Containers | ashimo | 0 | 3,060 |
06-20-2011, 01:41 PM Last Post: ashimo |
|
| Page 1: Integrating Applications | ashimo | 0 | 2,976 |
06-20-2011, 01:39 PM Last Post: ashimo |
|
Users browsing this thread:
1 Guest(s)
1 Guest(s)


